A CanSat, short for "Canister Satellite," is a type of educational project that involves the design and construction of a small satellite that fits into the size and shape of a typical beverage can. The purpose of a CanSat is to provide students with hands-on experience in building and testing a satellite-like system, often within the constraints of a small budget.
Why CANSAT?
- Educational Experience
- Affordability and Accessibility
- Real World Application
- Telemetry and Data Analysis
- Global Community
SCHEMATICKIT ALGORITHMIC DESIGN (SKAD)
Developed and Designed by KIST Science & Technology Club
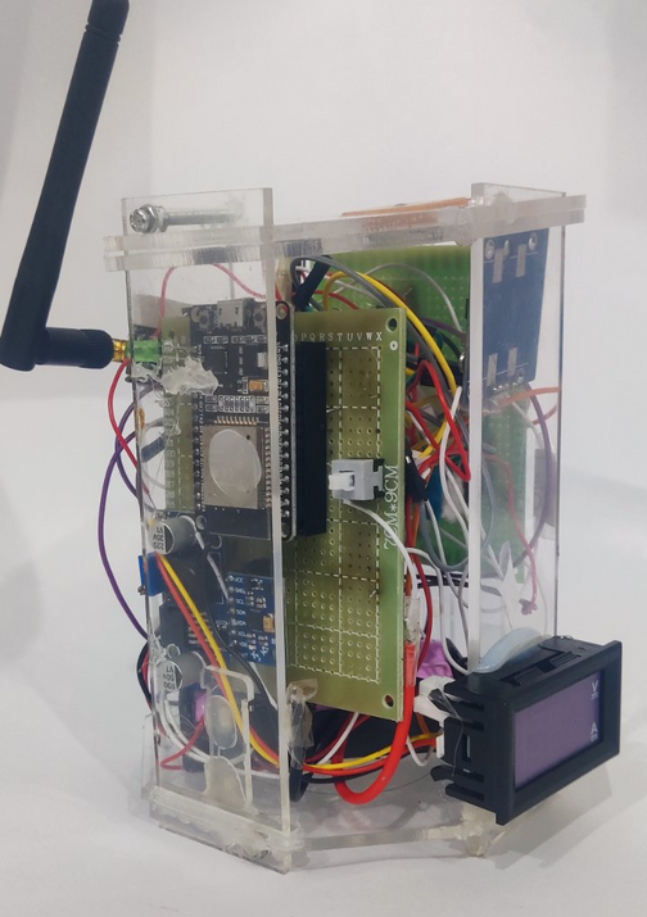
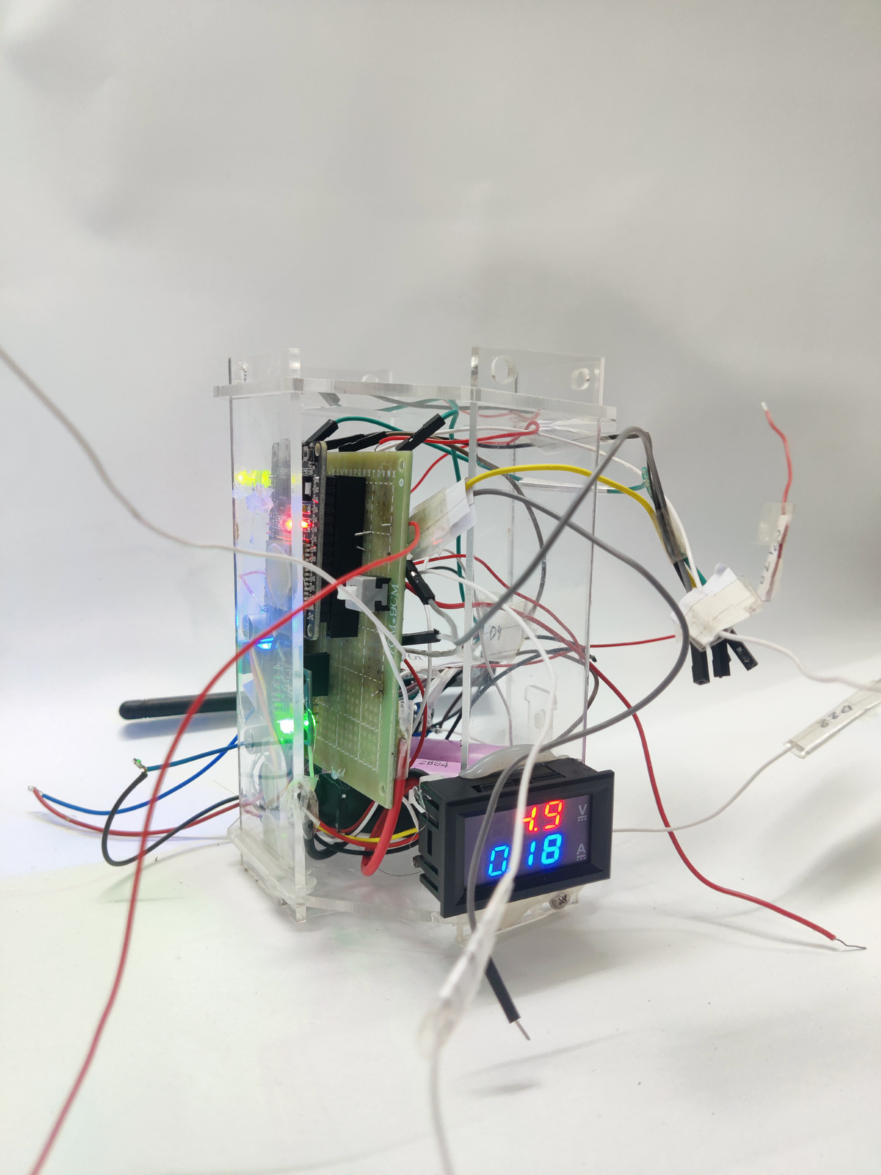
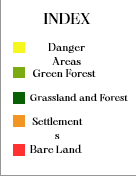
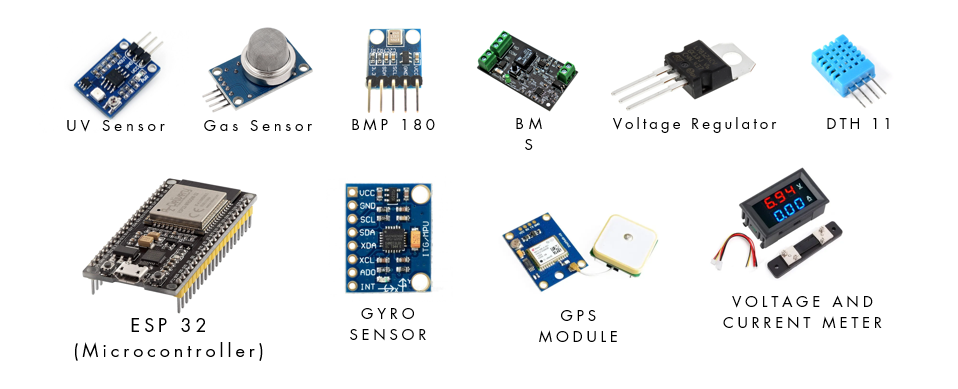
COMPONENTS OF SKAD
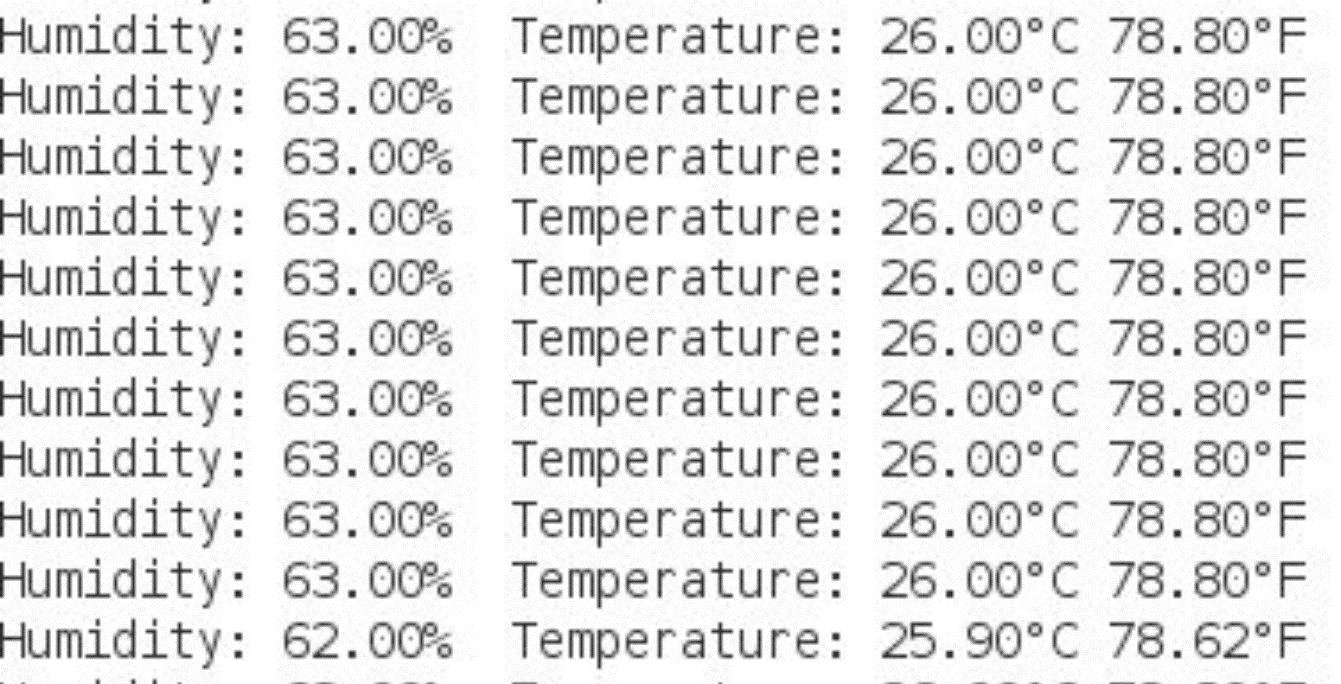
DIFFERENT READINGS ON GYRO SENSOR & HUMIDITY SENSOR
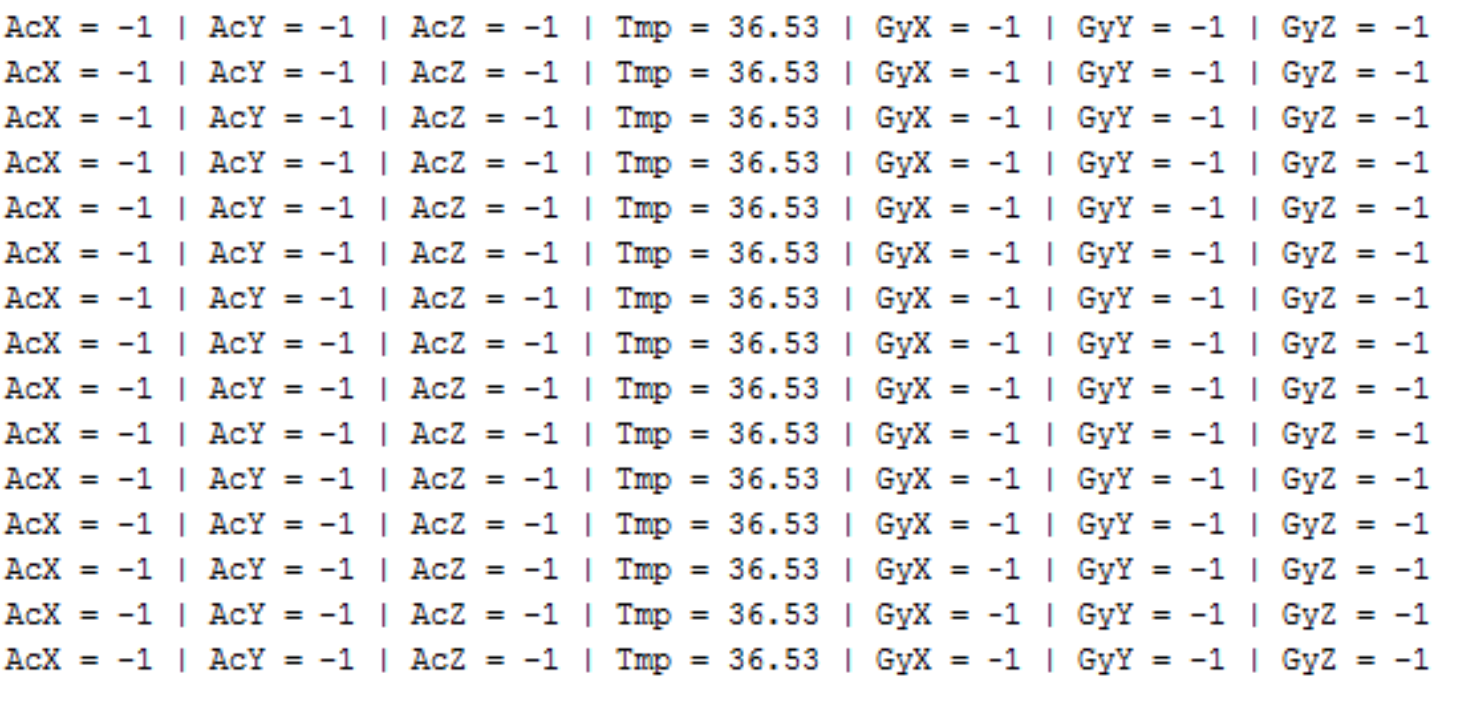 ..................
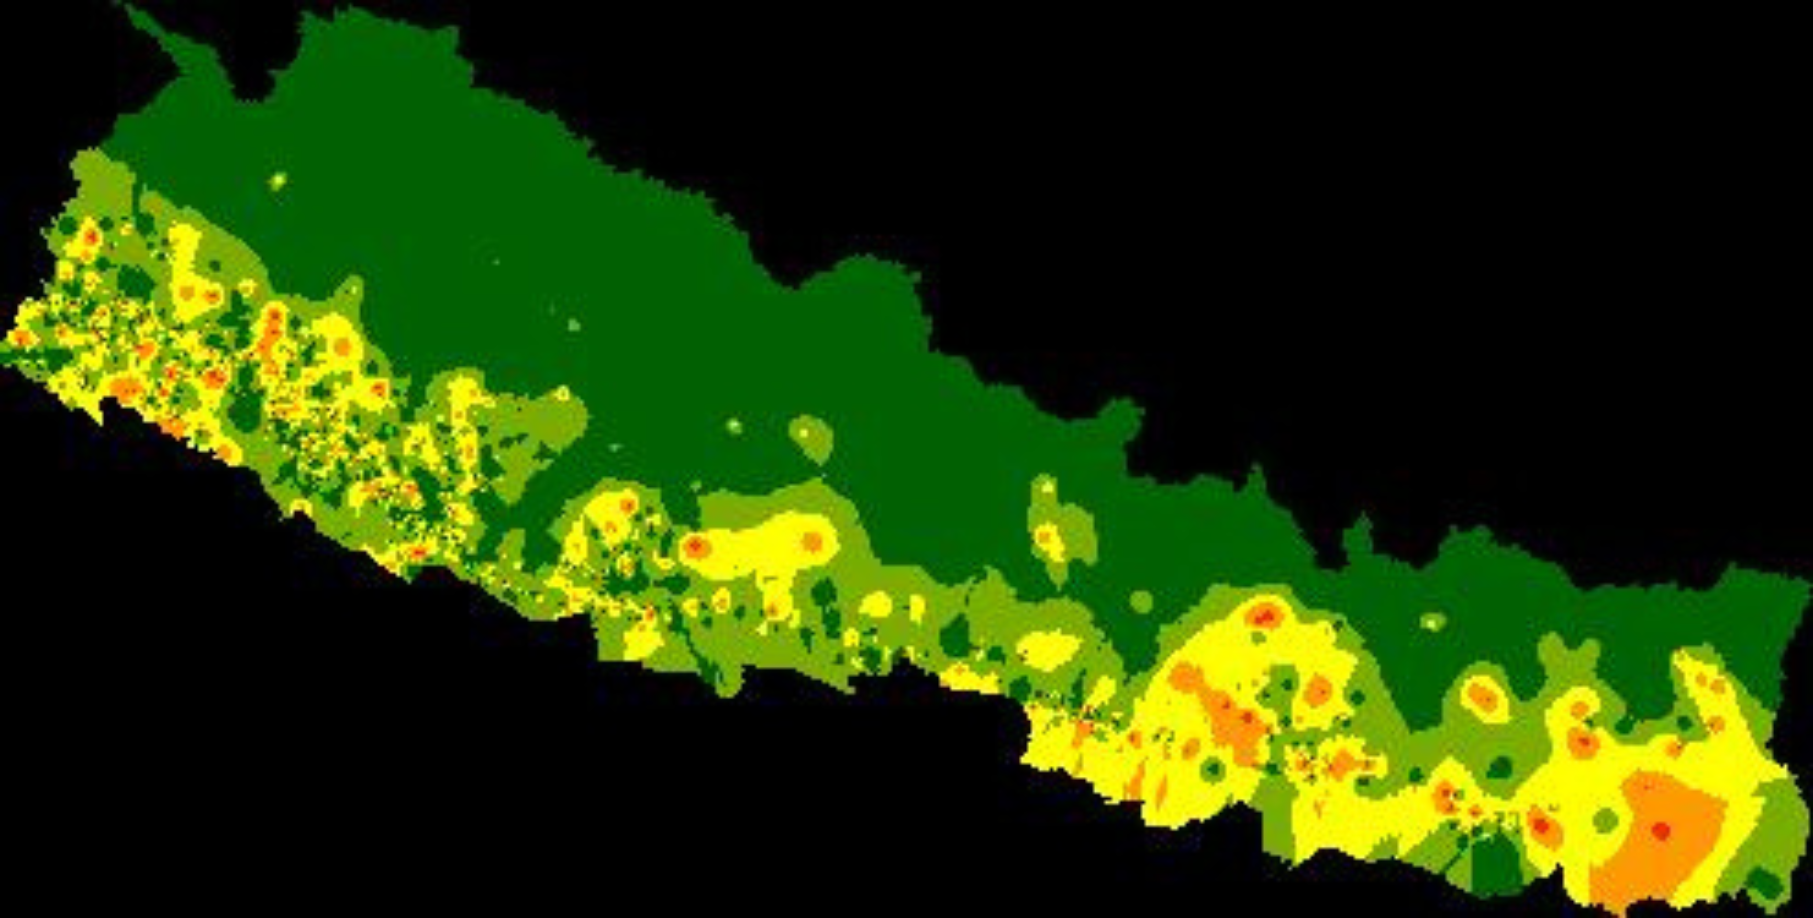
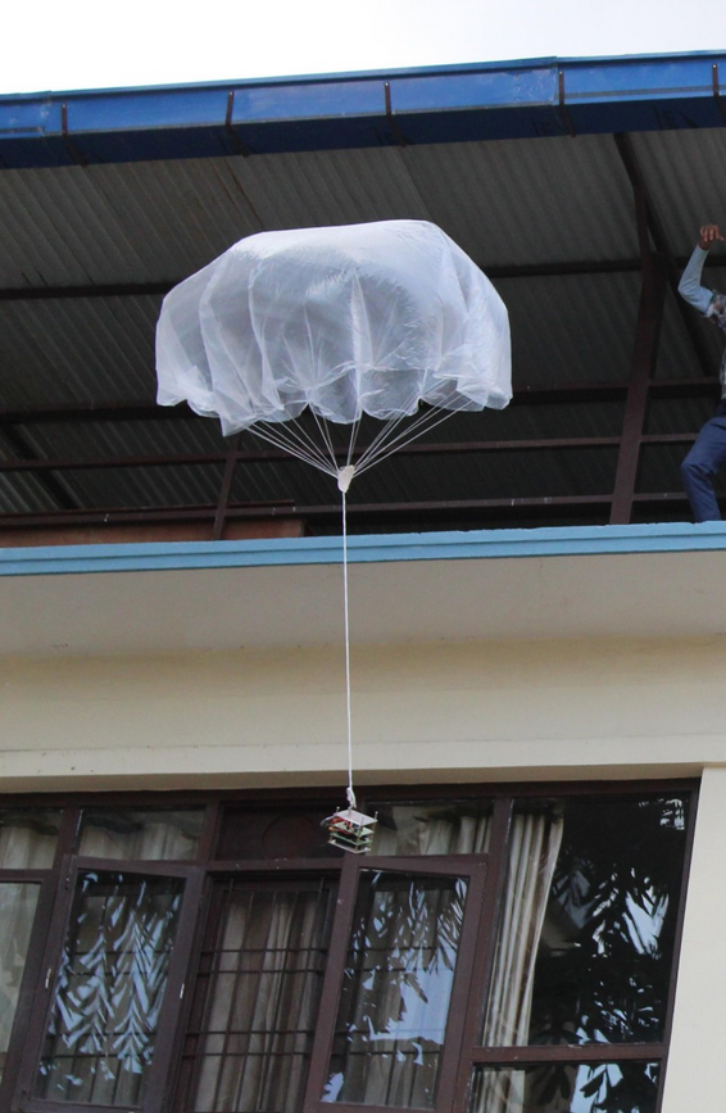
USE OF SKAD IN CONTEXT OF NEPAL
Weather Prediction
Through the use of different variables such as temperature, humidity, and pressure changes we can predict the local weather.
Crop production prediction
With the data accessed from our weather prediction, we can compile that data with the past year's crop production to predict crop production
RANDOM FOREST
- SEGREGATION
- Data were categorized according to the group and classes.
- GROUPING
- Data of same class and domain were used distinguish the objects
- TESTING
- Random forest allows the testing of data with less training data which gives accurate prediction model
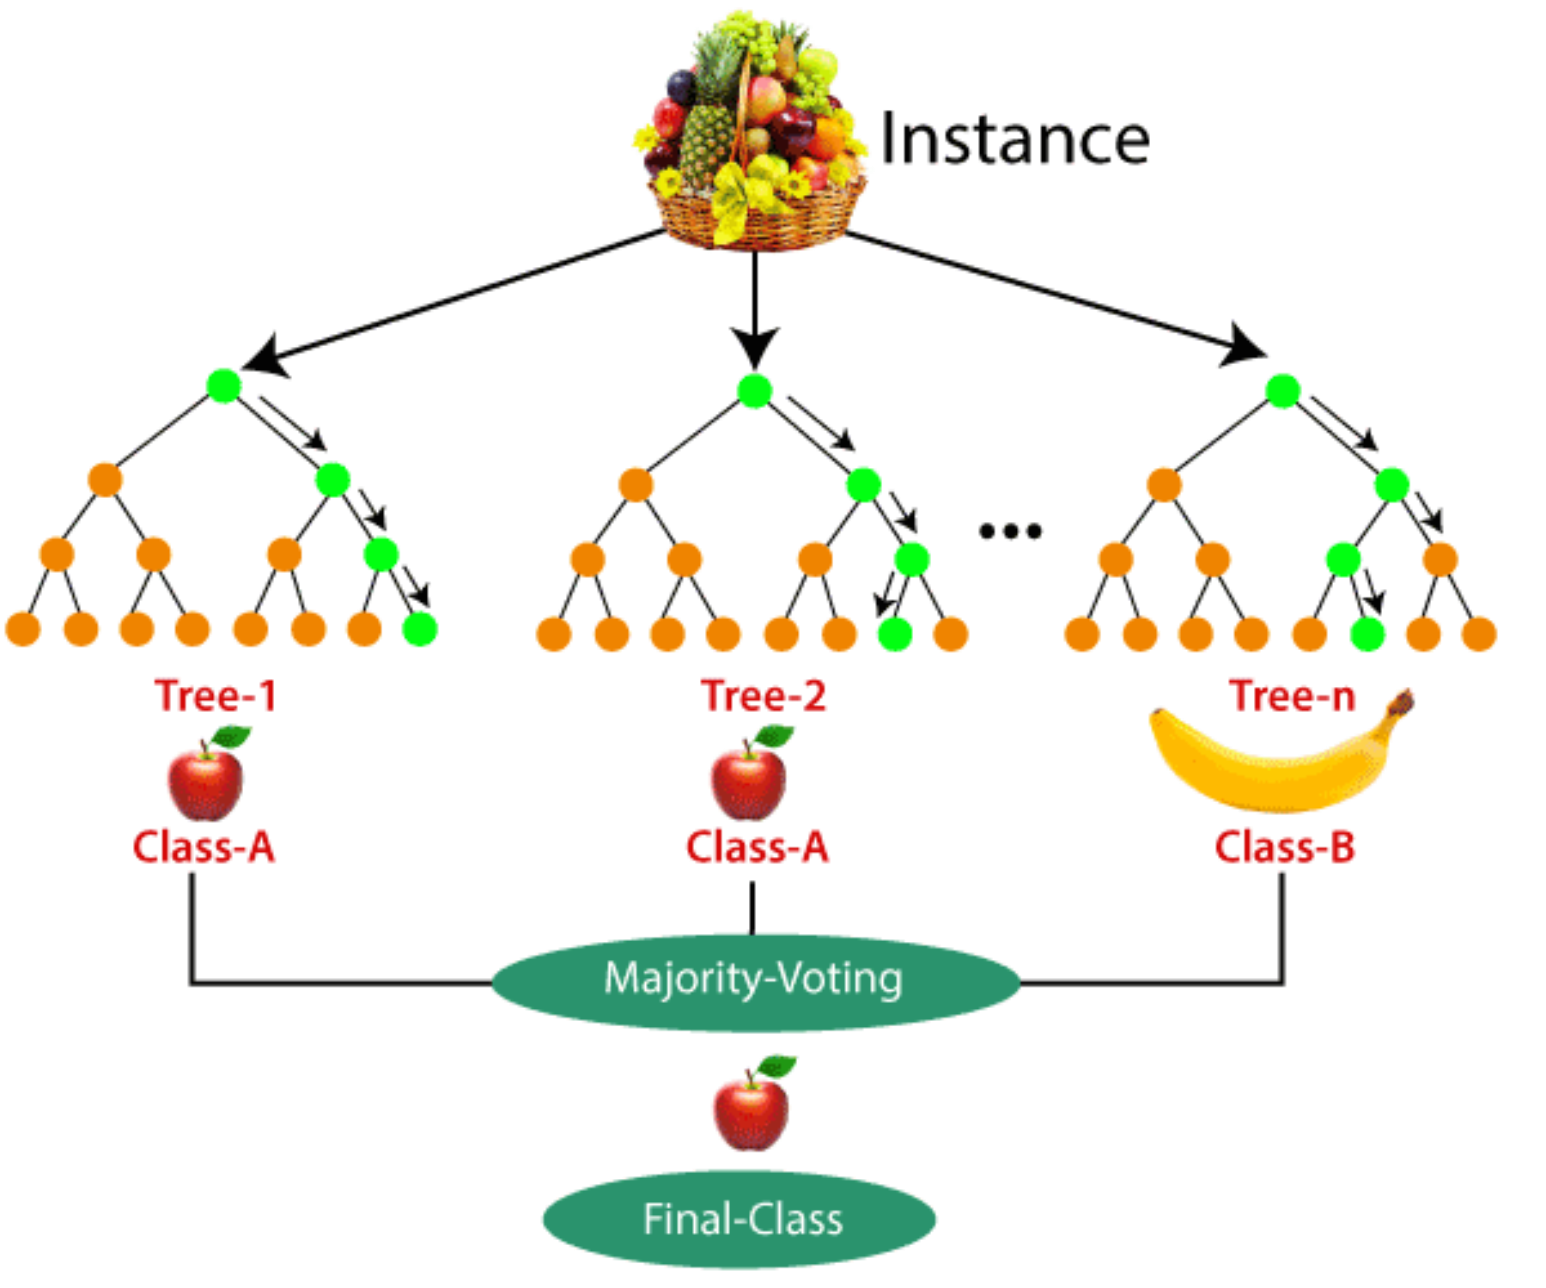
Why To Use Random Forest?
[1] G. Shao, W. Han, H. Zhang, S. Liu, Y. Wang, L. Zhang, X. Cui, "Mapping maize crop coefficient Kc using random forest algorithm based on leaf area index and UAV-based multispectral vegetation indices," Agricultural Water Management, vol. 252, p. 106906, 2021
[2] J. E. Ayala-Izurieta, C. O. Márquez, V. J. García, C. G. Recalde-Moreno, M. V. Rodríguez-Llerena, and D. A. Damián-Carrión, "Land Cover Classification in an Ecuadorian Mountain Geosystem Using a Random Forest Classifier, Spectral Vegetation Indices, and Ancillary Geographic Data," Geosciences, vol. 7, no. 2, pp. 34, 2017. DOI: 10.3390/geosciences7020034.
[3] L. Liang, L. Di, T. Huang, J. Wang, L. Lin, L. Wang, M. Yang, "Estimation of Leaf Nitrogen Content in Wheat Using New Hyperspectral Indices and a Random Forest Regression Algorithm," Remote Sensing, vol. 10, no. 12, p. 1940, 2018.
[4] Dobrinić D, Gašparović M, Medak D. Sentinel-1 and 2 Time-Series for Vegetation Mapping Using Random Forest Classification: A Case Study of Northern Croatia. Remote Sensing. 2021; 13(12):2321. https://doi.org/10.3390/rs13122321
[5] Y. Zhang, B. Sui, H. Shen, and L. Ouyang, "Mapping stocks of soil total nitrogen using remote sensing data: A comparison of random forest models with different predictors," Computers and Electronics in Agriculture, vol. 160, pp. 23-30, 2019.
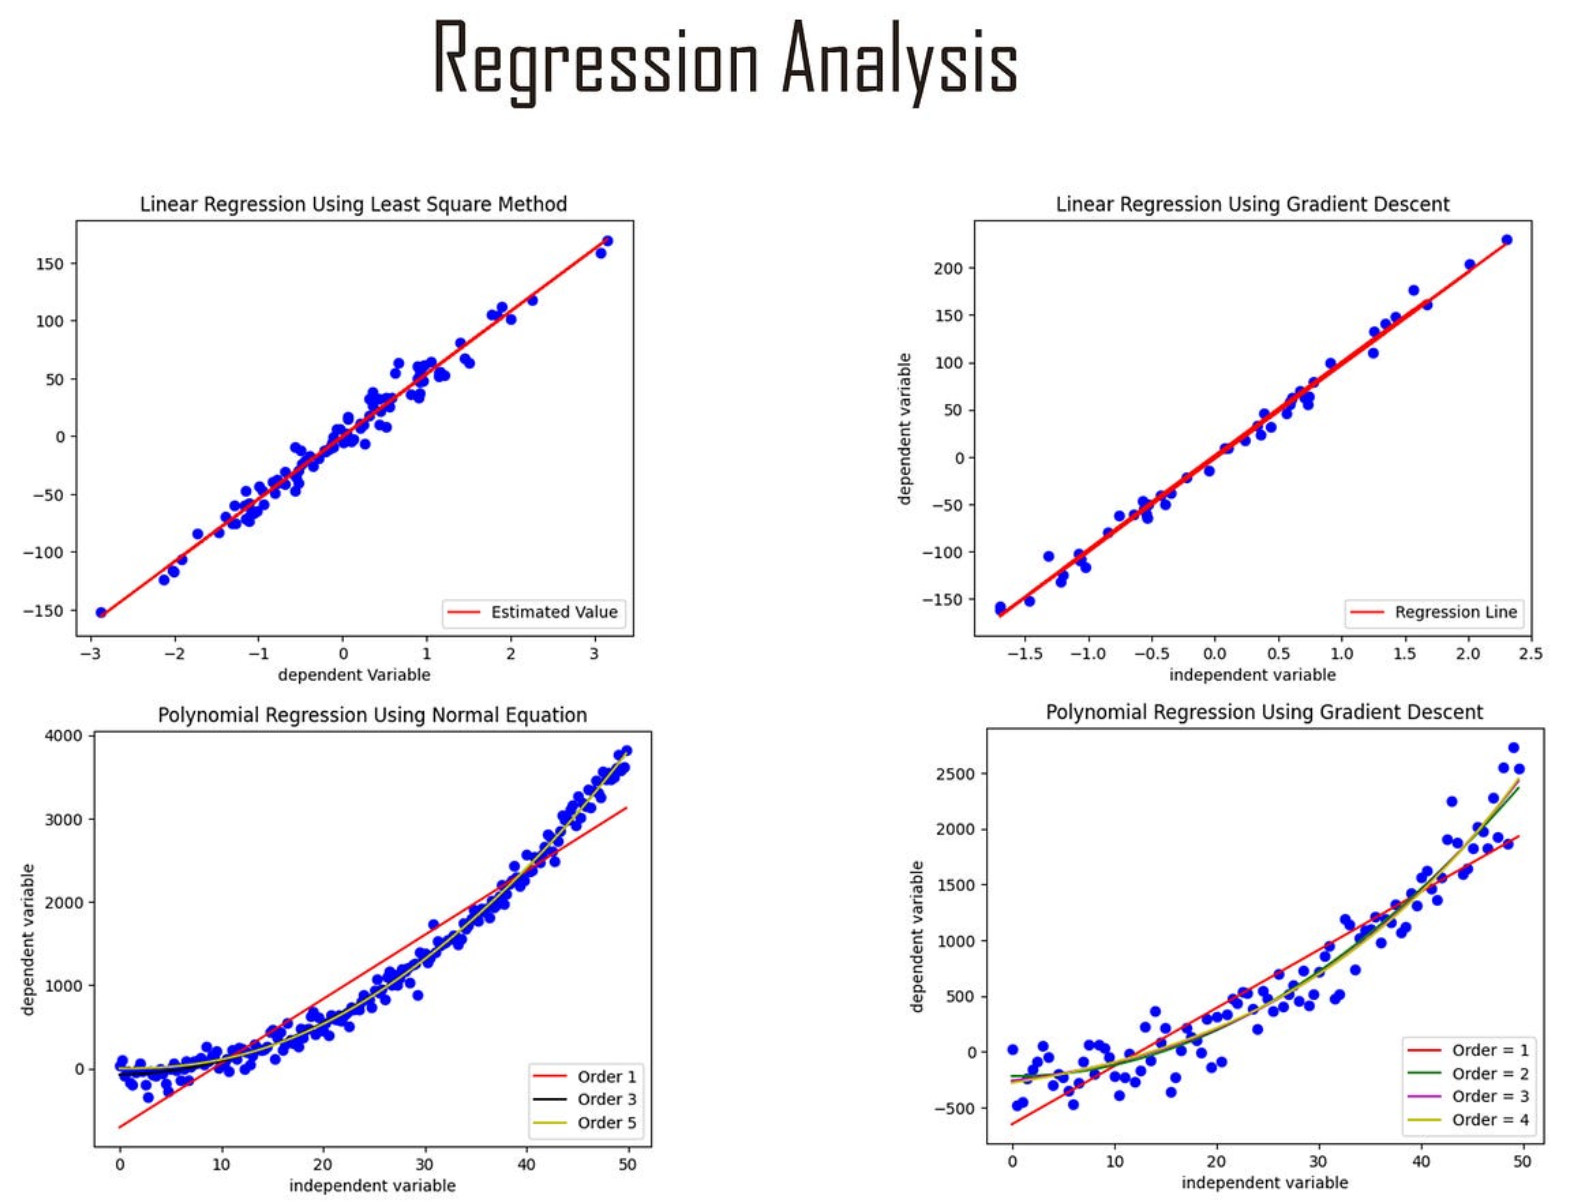
REGRESSION MODEL
Here, the regression model predicts the co-relation of all the sets of values and their outcomes. The values sometimes can be linear but in most of the cases they won’t show the linear expansion.
VARIABLES OF SKAD MODEL
- NDVI(Natural Difference Vegetation Index)
- DEM(Digital Elevation Model)
- Gas Concentration
- Temperature
- Humidity
ROC Curve
ROC curve output given by the Machine Learning model
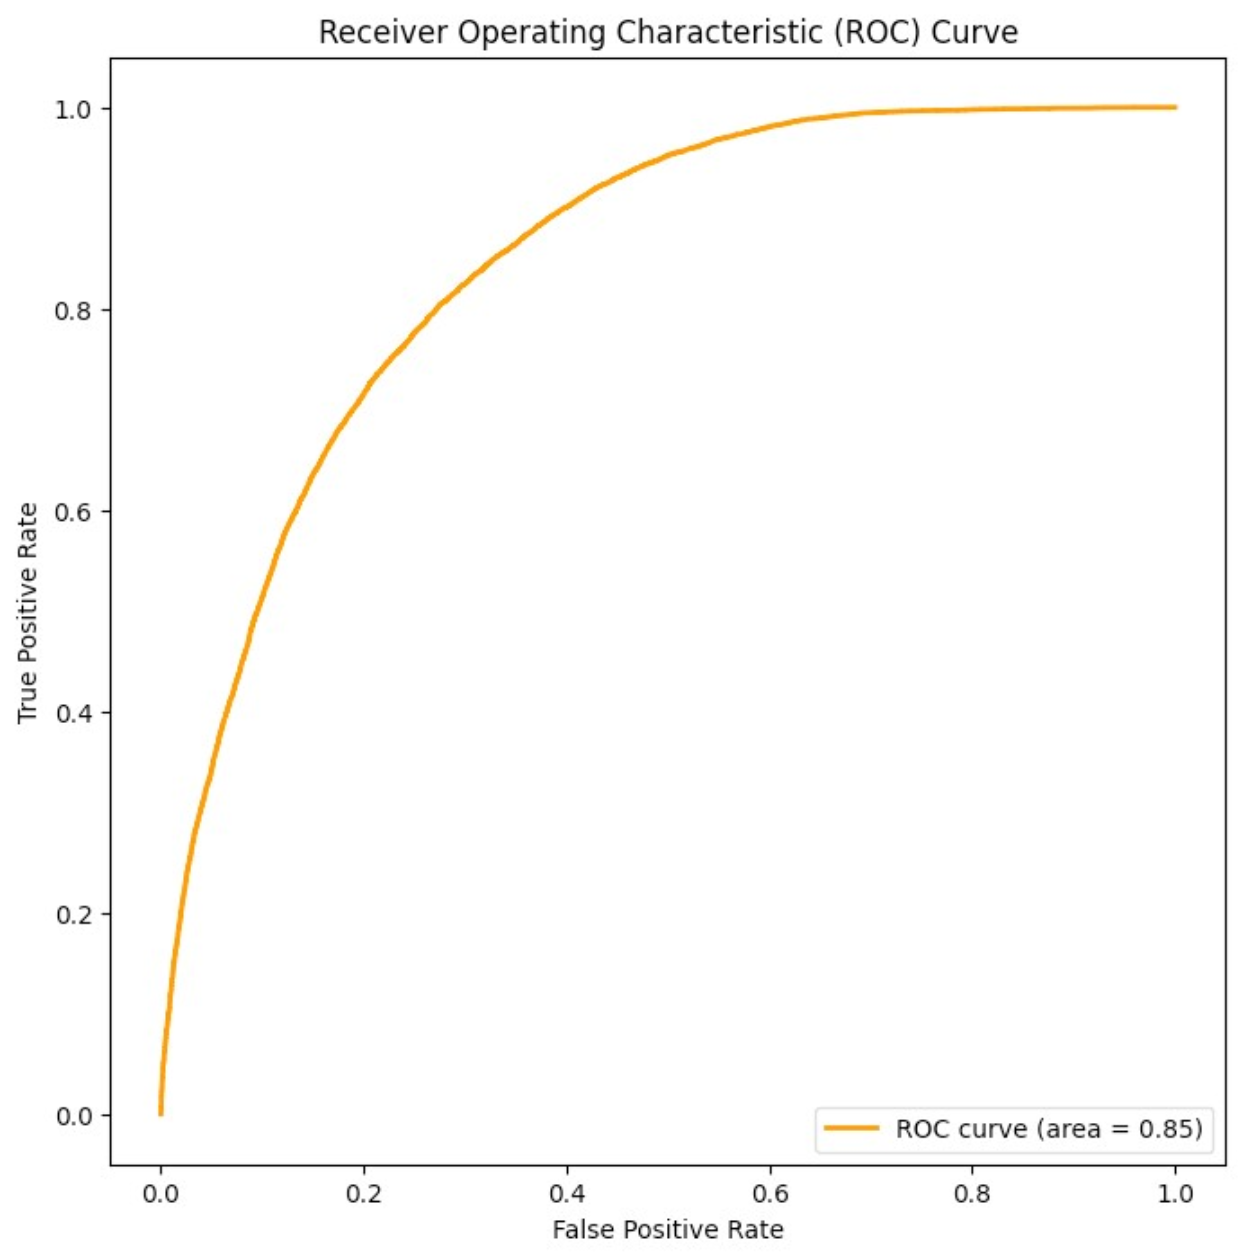
MODEL PREPARED BY RANDOM FOREST